Socrata Help
Provided here are helpful tips on how to use the features on the State of Hawaii’s open data portal site, data.hawaii.gov, which is currently powered by Socrata.
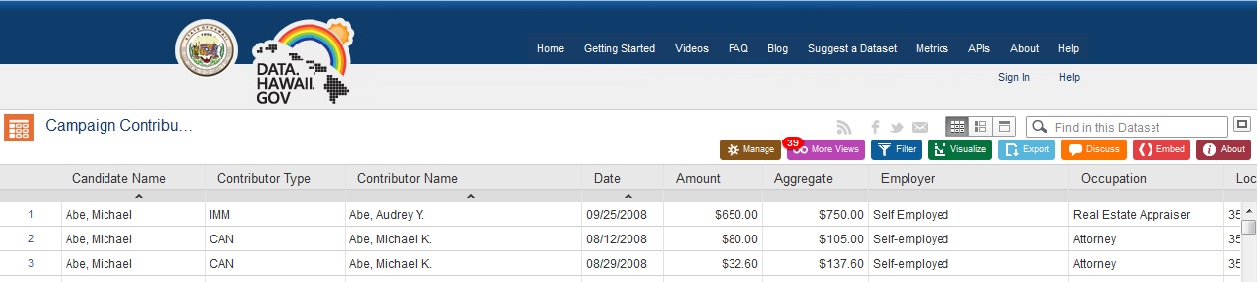
Below is how the dataset will look on data.hawaii.gov after it is opened. Use the horizontal scroll bars to scroll left and right to view all fields in a record, and use the vertical scroll bars to scroll up and down to view all records in the dataset.
There are many data manipulation tools that you can use on the data.hawaii.gov site. For example, you can create your own filtered views, geocoded maps, pie charts, etc. Your options are only limited to your creativity. You can create things for your temporary use or you can save them for the public to view. Before you are allowed to save, you must first create a Socrata account which is free and easy to do. Click on ‘Sign In’ below the top blue bar and follow the instructions to create your own personal account. All original datasets on this site are read-only so there is no risk in damaging them.
| Icons | What it does |
|---|---|
|
Sign-up here to be informed of updates to this dataset via RSS feeds or email. |
|
|
Allows you to share the dataset through Facebook, Twitter or Email. |
|
|
Click any of these options to view the dataset in different formats: table, rich list or single row. |
|
|
Allows you to search all fields within the dataset. Type in search term and press enter. |
|
|
Allows you to show or hide columns in the dataset. You can also rearrange the columns in the order you prefer. |
|
|
Provides a list of filtered views, charts or maps that are associated with this dataset. In this example, there are 39 views associated with this dataset. |
|
|
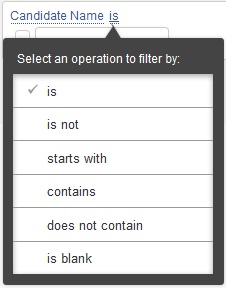
Allows you to sort and filter the data in the dataset according to your preference:
Filter the dataset by selecting a column, choosing a condition, and entering a parameter. |
|
|
Provides you with four (4) options to compile and organize the data into a graphical representation:
|
|
|
Provides you with three (3) options to export the dataset to your computer:
|
|
|
Allows you to view the discussion feed relating to conversation and activity on a dataset. Also, this is where you can leave a comment regarding a dataset for the Commission to see. |
|
| Allows you access to the Social Data Player which enables you to publish this dataset on the Internet at large. It provides html code that you can add to your website which is a link to the dataset on the Socrata site. | |
| Provides you with further information related to the dataset. | |
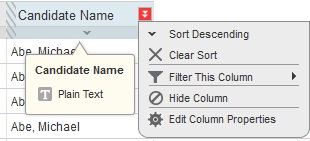 |
By clicking on a column title, then clicking on the red arrow box, you can access functionality that can be done on a column. You can sort the dataset by the selected column, filter the dataset by the column, hide the column, or edit the column’s properties. |
Recent Tweets
Check out the Commission's July 2025 Newsletter #CSCNewsletter

CSC Newsletter – July 2025, Vol. 31, No. 2
WRAP-UP OF THE 2025 LEGISLATIVE SESSION For the 2025 legislative session, the Hawaii Campaign Spending Commission (“...
bit.ly
Senator Donovan Dela Cruz files Notice for 7/15/25 fundraiser https://bit.ly/3GiOD4B #HIFundraiserNotices
Christina Everett files Notice for 7/23/25 fundraiser https://bit.ly/3TvwQdq #HIFundraiserNotices
Representative Ikaika Olds files Notice for 7/29/25 fundraiser https://bit.ly/405gTOI #HIFundraiserNotices